World map by year
The world in 2010
A planet divided almost entirely into nation-states, nearly two hundred of them.
191 named states on the map
largest: Russia
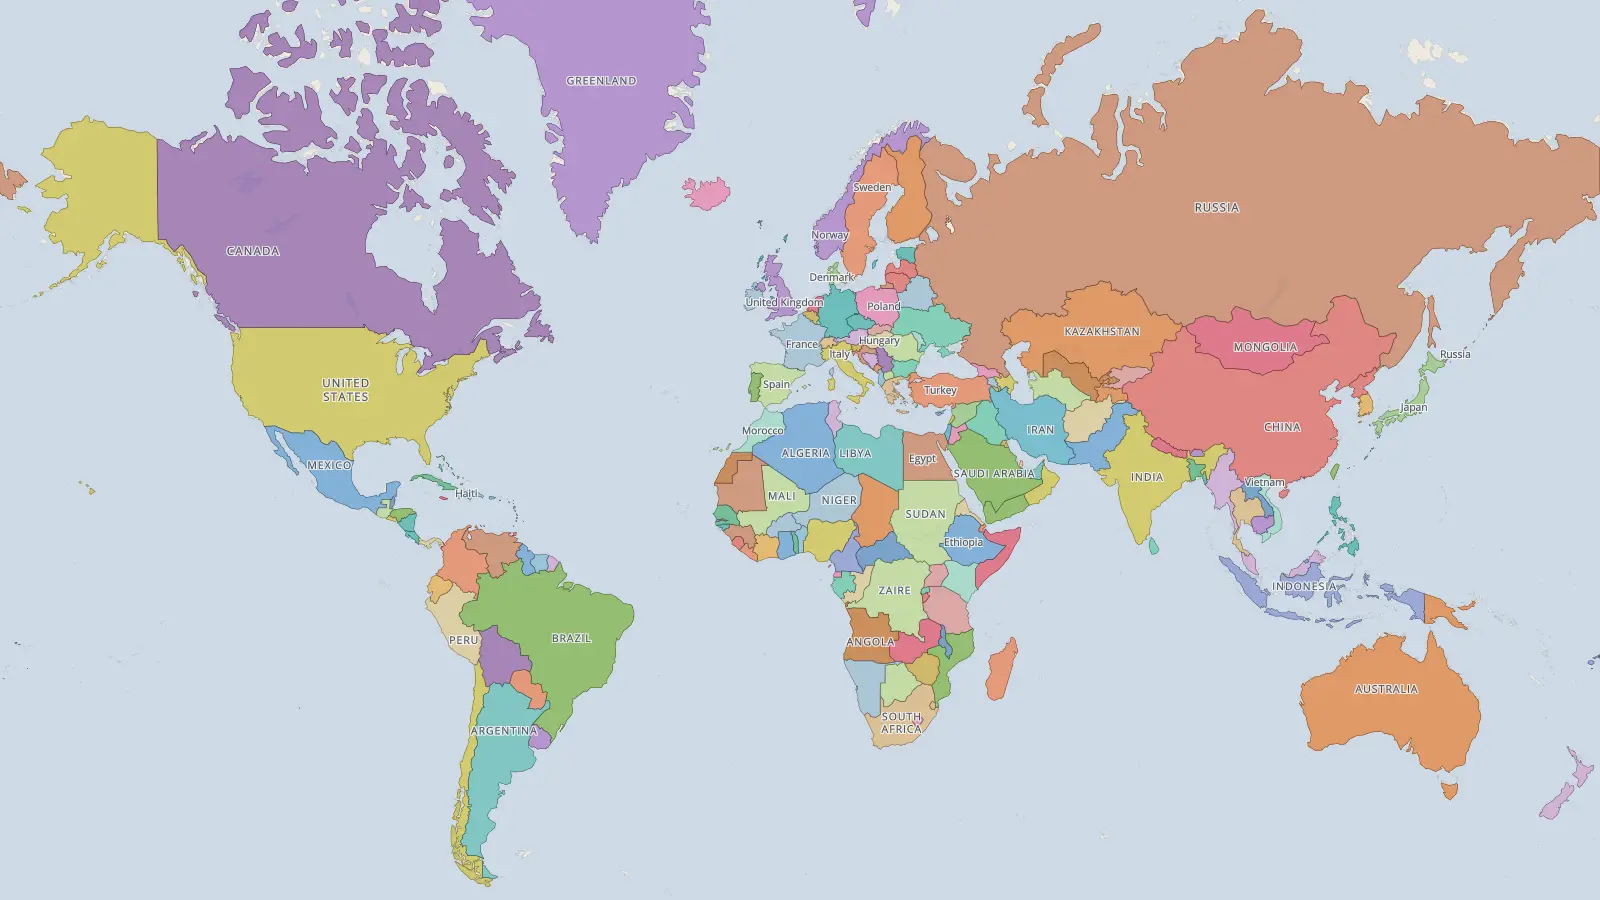
Explore 2010 full screen
Click any border for its story, and drag the timeline to watch the map change in the years before and after 2010.
The largest states in 2010
top 10- 1Russia16,568,790 km²
- 2Canada9,509,353 km²
- 3China9,335,863 km²
- 4United States9,253,781 km²
- 5Brazil8,420,194 km²
- 6Australia7,661,521 km²
- 7India3,151,366 km²
- 8Argentina2,770,392 km²
- 9Kazakhstan2,708,757 km²
- 10Sudan2,507,460 km²
Measured on the sphere from the borders drawn on this year’s map, including colonies and dependencies shown as part of a state.
Watch these years move
Questions
- What did the world look like in 2010?
- A planet divided almost entirely into nation-states, nearly two hundred of them.
- What was the largest empire in 2010?
- On this map, the largest state is Russia, covering about 16.6 million km², followed by Canada, China, United States.
- How many countries were there in the world in 2010?
- The 2010 map of the world shows 191 named states. The count depends on how finely a map divides the world, so maps from different sources give different numbers, and borders in early periods are approximate.
Every year on one page →Europe in 2010 →The Middle East in 2010 →South Asia in 2010 →Africa in 2010 →
Borders from historical-basemaps by André Ourednik, with our own corrections. Borders in early periods are approximate.